
Blog
Why one search position number is rarely enough
A practical way to compare query, location, device and date before interpreting a ranking change.
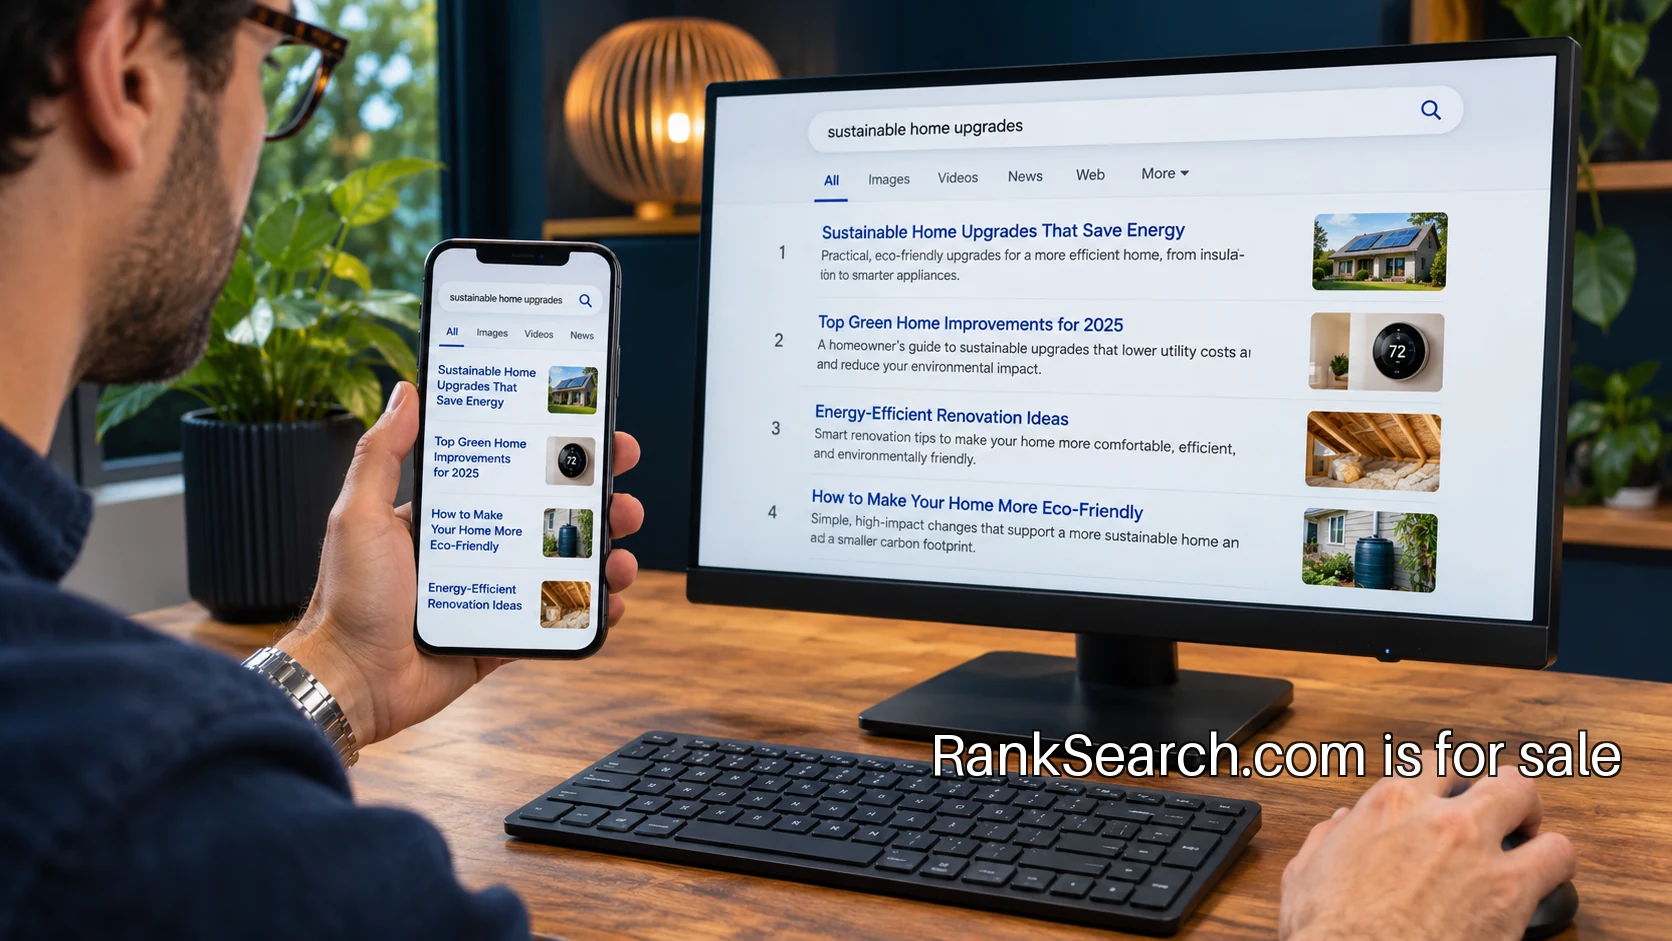
Two reports can show different search ranking numbers without either report being broken. One may describe a single query checked from one location. Another may summarize many impressions across queries and devices. Before debating which figure is correct, write down what each figure measures. That simple step often turns a confusing disagreement into a useful comparison.
This guide is for a practitioner who needs to interpret a change before recommending work. The aim is a fixed measurement protocol: a record of the query set, source, location assumptions, device, dates and aggregation method. Once those are explicit, a team can compare observations consistently and explain the limits of the evidence to a colleague.
Start with the unit being measured
A position observation needs an object. Is it the position of one page for one query, the highest result from a property, or an average across many recorded appearances? Those are different units. A label such as “rank” is too short to explain the difference. Give each report a definition that someone outside the reporting team can read.
In Search Console, position has a platform-specific definition. Google's explanation of impressions, position and clicks is the relevant source for interpreting that data. Review the definition rather than treating the report as a reproduction of a manual search. For other tools, obtain the corresponding methodology and retain it with the reporting protocol.
A useful protocol records the data source and version of the definition reviewed. It also states whether the report covers a site, a page, a query group or an individual query. A future analyst should not have to reverse engineer the original intent from a chart title or a forgotten filter.
Fix the query cohort
An average can change because the underlying set changes. Suppose a fictional site appears for a small group of established queries in one month and a much broader set in the next. A blended position value may move even if the established queries are stable. The first question is therefore which queries entered or left the observed set.
Keep a fixed cohort for comparisons that need continuity. Review that cohort separately from the full set of observed queries. The full set is still useful for discovery; the fixed set helps explain movement within a defined group. Put the distinction in the report so a reader can tell whether the team is discussing growth in coverage or a change in familiar queries.
Separate device and geography
A report limited to one device should not be compared casually with an all-device report. Search experiences and the mix of users can differ. Start with the same device filter for both periods, then inspect other device groups if the difference matters to the decision. Preserve the filters in the exported evidence as well as the live dashboard.
Location needs the same care. A manually observed result near a business may answer a useful local question, but it is not automatically representative of every nearby customer. If a third-party tool samples locations, record those locations and the method. For a recurring local comparison, use the same agreed locations before interpreting changes as a trend.
Use comparable date windows
Choose complete periods that make sense for the business question. A seven-day window can help compare weekday patterns when there is enough activity, while a low-volume site may need a longer period. Avoid comparing an incomplete current period with a complete prior period unless the report explicitly explains that limitation.
Keep an annotation log for releases, measurement changes and known interruptions. The log does not prove that a release caused movement. It gives the analyst a timeline to investigate. A report should distinguish an observed change from the explanation being considered and show what additional evidence would make that explanation more convincing.
Work through a comparison
Consider a fictional service site with two reports. The first shows a blended average position of 12 for one month and 15 for the next. The second shows little change across a fixed group of ten desktop queries checked in one city. Those figures can coexist. Neither alone answers whether the pages important to the business became less visible to the intended audience.
Break the question into steps. Confirm the periods and device filters. Inspect the query mix in the blended report. Separate the established group from newly observed queries. Compare the relevant pages and note any changes in the result types represented. Then inspect clicks and impressions in the same cohort rather than bringing unrelated totals into the explanation.
Suppose the fixed cohort is stable while new queries appear mostly at lower positions. The practical discussion may be about the new coverage rather than a decline in the established group. That remains a hypothesis until the data supports it. The analyst can present the cohort tables and explain exactly which conclusion they support.
Read adjacent metrics without merging their meanings
Position, impressions and clicks provide different views of activity. A position change is not a substitute for a click change, and a click change does not explain its own cause. Keep the measures side by side with the same filters. Note when the report includes different search surfaces or result types so the team does not compare unlike observations.
The official Search Console introduction is useful for understanding where the tool fits into monitoring and debugging. Use the tool to investigate a specific question. A dashboard becomes much easier to interpret when each view is attached to a question the team is actually trying to answer.
Decide what evidence would change the action
If the next action would be the same regardless of a small movement, the report may not need a long argument about that movement. A broken destination, an inaccurate service description or a missing measurement connection can deserve attention on direct evidence. Reserve detailed ranking analysis for decisions where it can alter the priority or scope of the work.
For a suspected visibility issue, write down a testable question. For example: did the established mobile query cohort change after the relevant release, using complete comparable periods? State the evidence needed and assign someone to collect it. This makes the investigation finite and prevents the team from collecting more charts without clarifying the decision.
Save a protocol others can repeat
End with a short measurement record: source, object, query cohort, device, geographic assumptions, date window, exclusions and known gaps. Include the export or saved view used for the conclusion. On the next reporting cycle, compare against that record before changing the method. When the method needs to change, mark the break so continuity is not implied.
The result is a report a colleague can question productively. They can inspect the cohort, challenge the interpretation and propose another explanation without arguing about an undefined number. That is the foundation for useful search measurement: a clear object, a stable comparison and evidence proportionate to the decision.
A focused name for your next search business
Discuss acquiring RankSearch.com for the brand you intend to build.
Request Info